Command-line interface
Below we show the basic usage of the command-line interface (CLI), for more in-depth information run asli --help or the CLI reference.
Setting up Climate Data Store Credentials
To download these data from the Copernicus Climate Data Store, you will need an account and API key.
Please see the CDS API documentation: https://cds.climate.copernicus.eu/how-to-api
Register an account and create your API key file at $HOME/.cdsapirc
The contents should look like:
url: https://cds.climate.copernicus.eu/api
key: <PERSONAL-ACCESS-TOKEN>
Downloading data asli download
Command-line utilities are provided as a convenient way to download the datasets required for this analysis.
asli downloaddownloads certain variables from ERA5, by defaultmean_sea_level_pressure.asli download --lsmdownloads land-sea mask ERA5 data.
The --help flags can be used to find out more information, e.g.
asli download --help
To download the land-sea mask for the Amundsen Sea region to the directory ./data, run:
asli download --lsm
To download the ERA5 mean sea level pressure data from 1959 (the start of ERA5) to the current year, also to the directory ./data, run:
asli download
Much of the download behaviour can be customised using flags for the temporal and spatial range as well as to download other variables from the ERA5 monthly averaged dataset. For more in-depth information run asli --help or the CLI reference.
Running calculations asli calc
To run the calculations of the locations of each montlhy pressure minimum, using the default options, run:
asli calc --output asli_1959-2026.csv ./data/era5/monthly/era5_mean_sea_level_pressure_monthly_1959-2026.nc
Additional options at the command line can control:
- the number of cores used for the parallel computation of the pressure minima,
- whether or not to include ERA5T non-finalised ERA5 data for recent months,
Run asli calc --help or see the CLI Reference for details.
Plotting asli plot
To produce a plot of the whole range in the msl files with the default settings, run:
asli plot --input asli_1959-2026.csv --output asli_1959-2026.png ./data/era5/monthly/era5_mean_sea_level_pressure_monthly_1959-2026.nc
Note
Note that we pass the csv file produced by the calc step in as the value to the --input option and the NetCDF file containing the ERA5 variables as the positional argument, similarly to the calc step.
To plot just one year, just add the --year option:
asli plot --input asli_1959-2026.csv --output asli_1959-2026.png --year 2025 ./data/era5/monthly/era5_mean_sea_level_pressure_monthly_1959-2026.nc
This will produce a file such as:
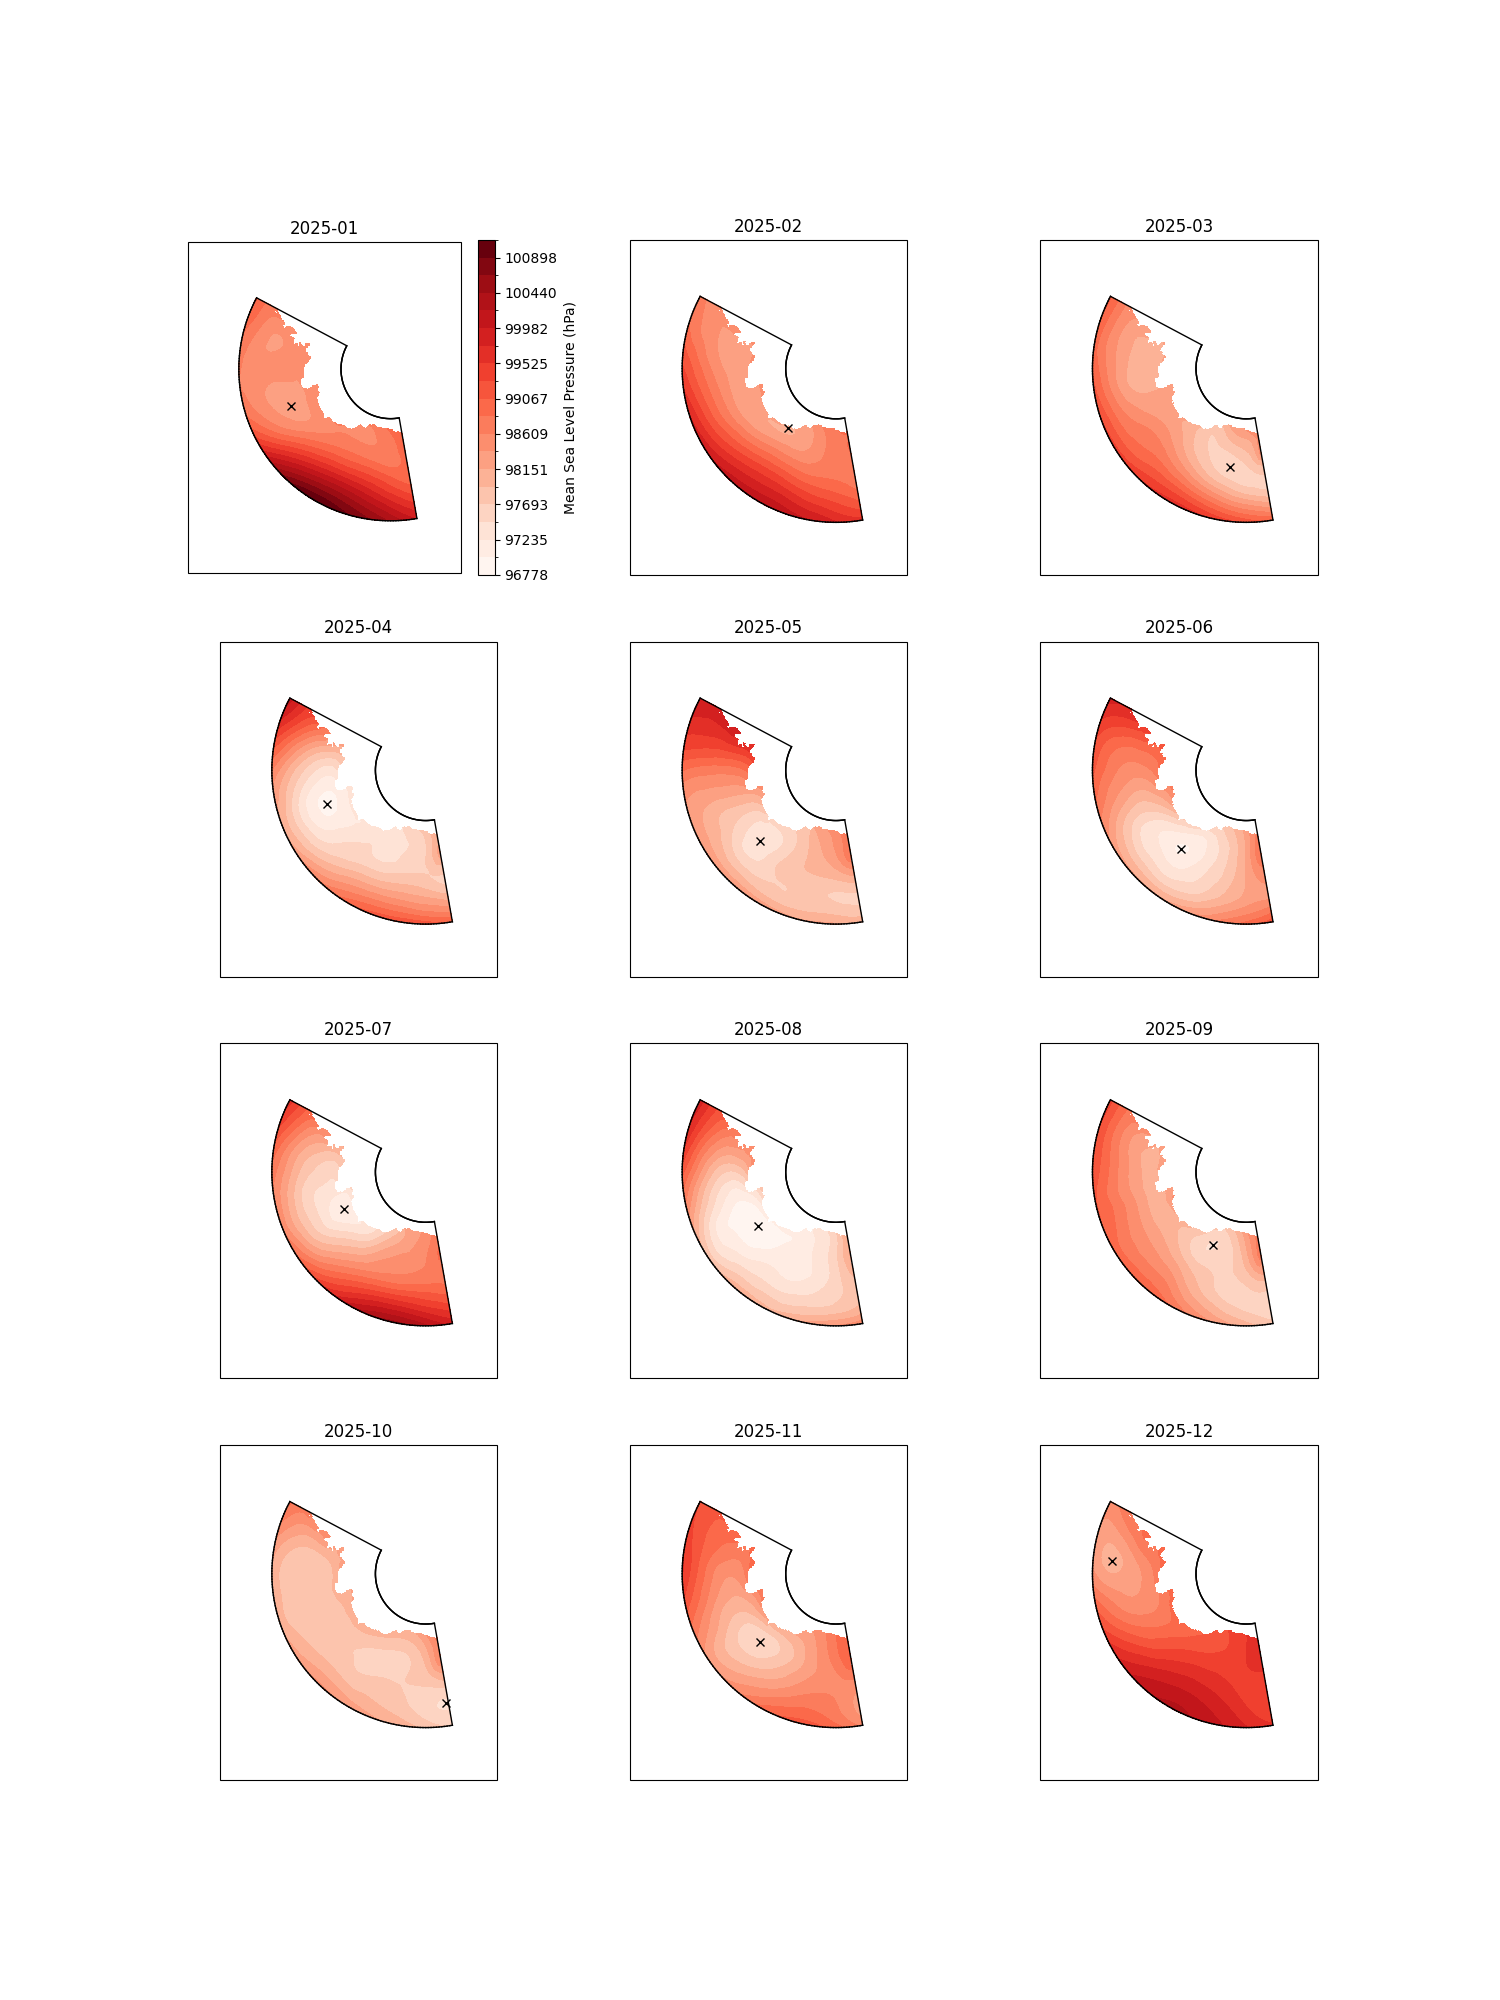
Note
Note that the extent of the pressure fields in the NetCDF file will be plotted. Here, we have only downloaded the region of interest, so the plot stops at the ASL region boundary.
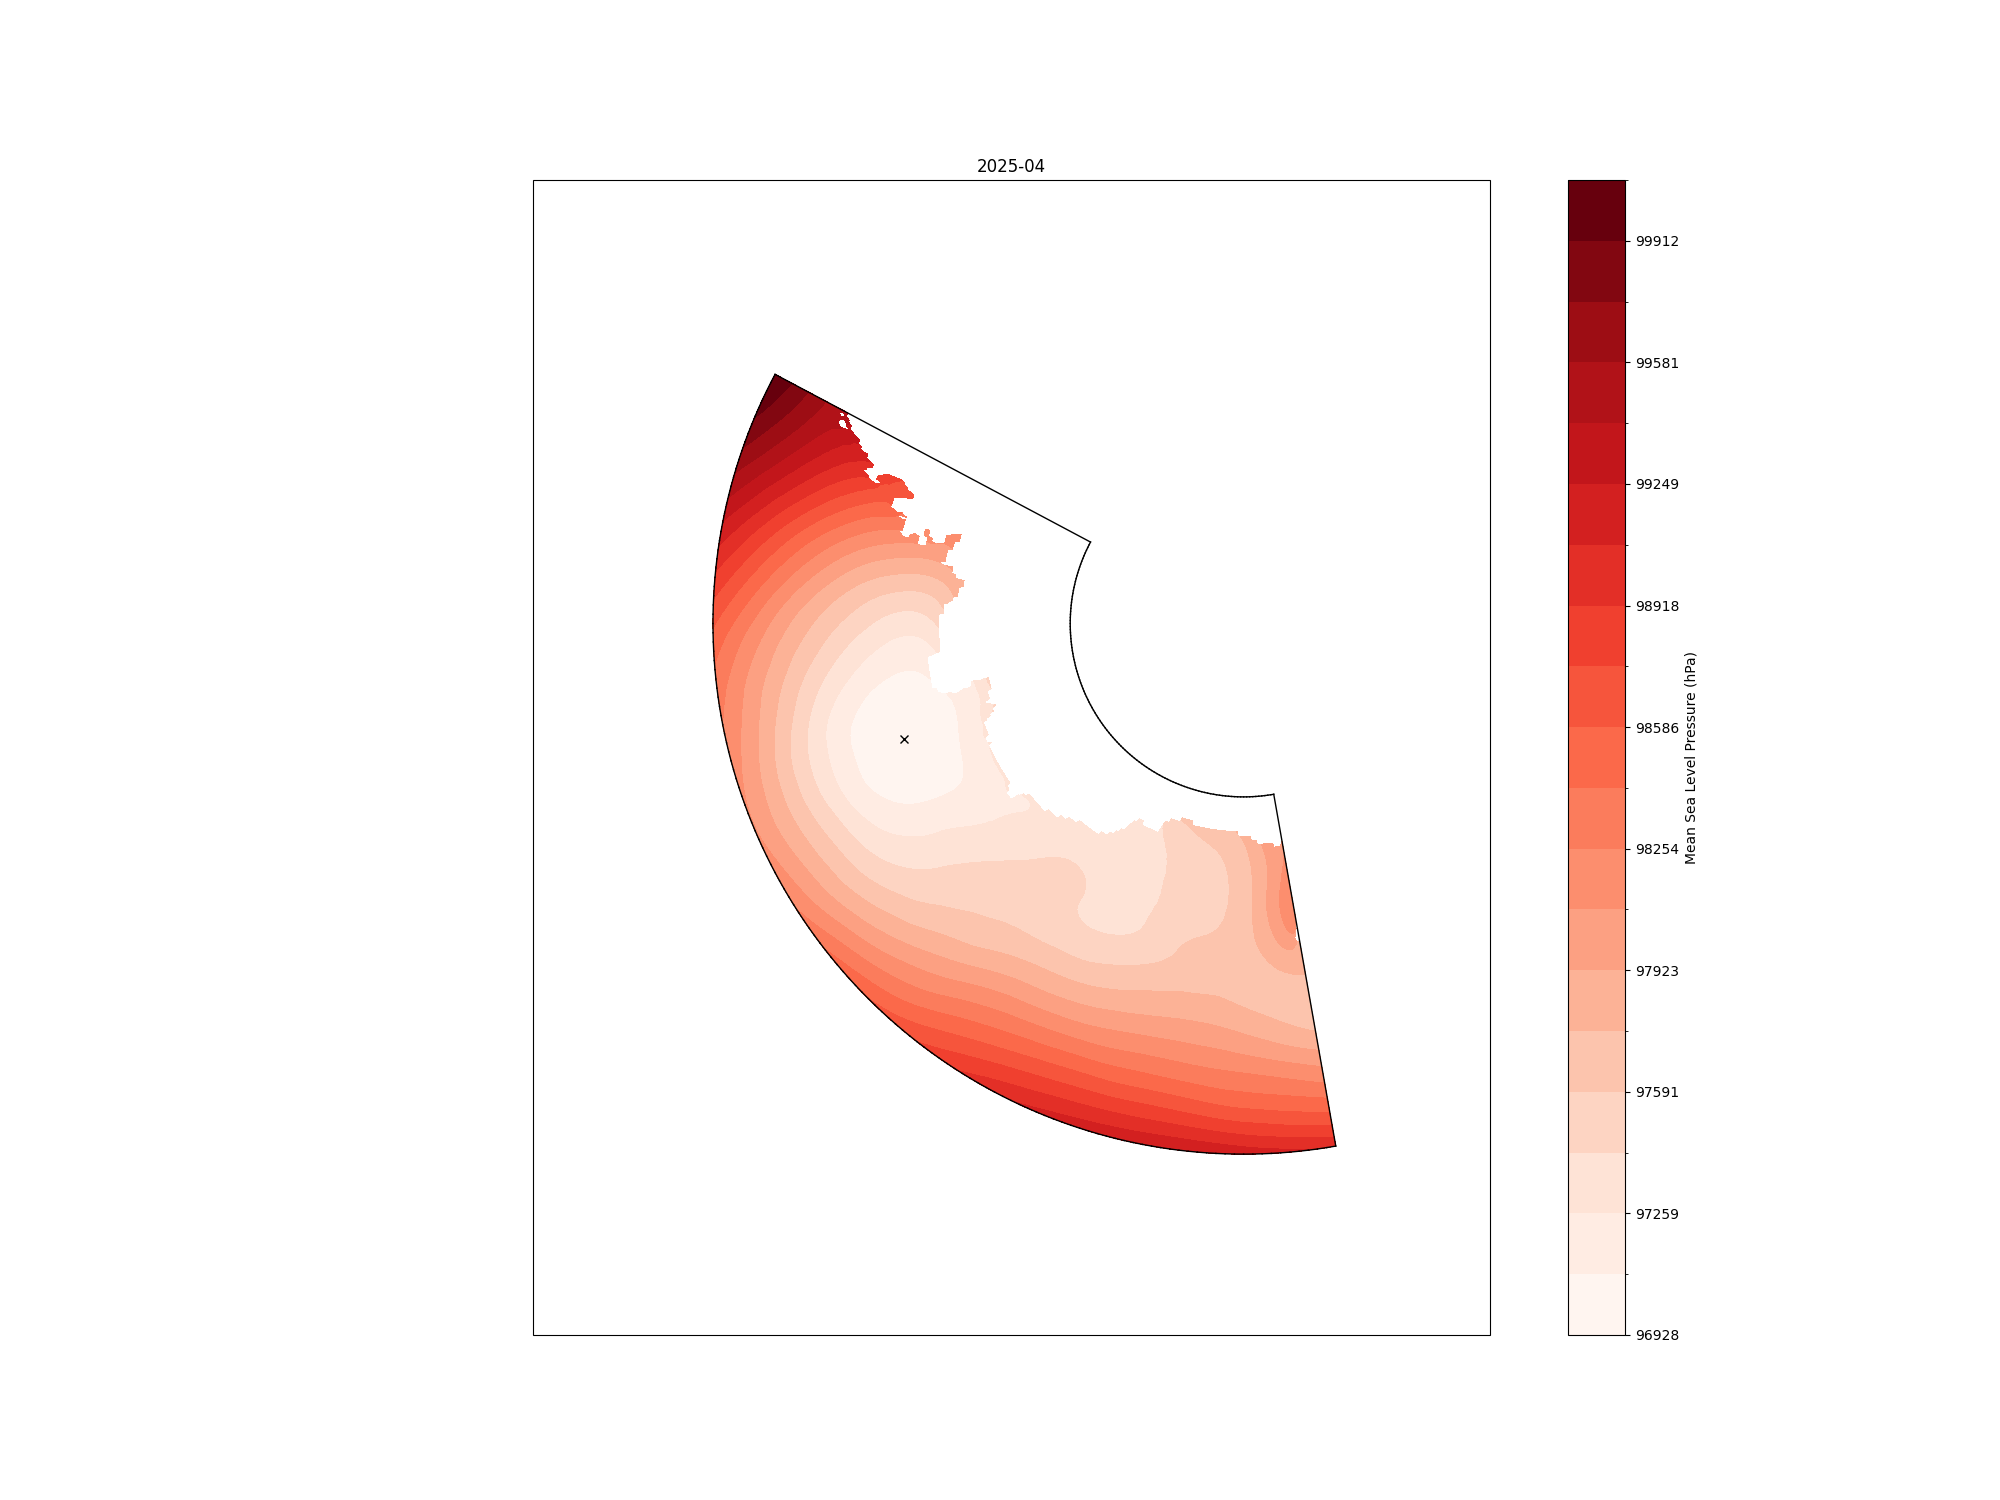
To plot just one month, add the --month option as well:
asli plot --input asli_1959-2026.csv --output asli_1959-2026.png --year 2025 --month 4 ./data/era5/monthly/era5_mean_sea_level_pressure_monthly_1959-2026.nc
With the output file: