Creating Shape Lines for BEDMAP3#
Author: Alice Fremand (@almand)
Date: 30/09/2022
The BEDMAP3 project#
Bedmap3 is a collaborative community project with the aim to produce a new map and datasets of Antarctic ice thickness and bed topography for the international glaciology and geophysical community, using a variety of data (including ice-thickness, bathymetry, surface altitude and grounding lines).
Additionally Bedmap3 will act as a repository and portal for standardized RES data for the glaciology and Geophysics community.
For more information about the project: https://www.scar.org/science/bedmap3/home/
Creating shape Lines#
The goal of the tutorial is to show how the Shape Lines have been created as an intermediary file of the BEDMAP3 project. The goal of this code is to create the tracks showing where the ice thickness data have been acquired.
The CSV data are available from the UK Polar Data Centre:
Bedmap1 standardised CSV data points: https://doi.org/10.5285/f64815ec-4077-4432-9f55-0ce230f46029
Bedmap2 standardised CSV data points: https://doi.org/10.5285/2fd95199-365e-4da1-ae26-3b6d48b3e6ac
Bedmap3 standardised CSV data points: https://doi.org/10.5285/91523ff9-d621-46b3-87f7-ffb6efcd1847
Virtual environment#
For the code to run, it is important to install the correct dependancies and libraries. In particular the following libraries are crucial for the code to be run:
geopandas
numpy
Scipy
math
Note: It is recommended to install geopandas first as it will upload most of the needed libraries at the same time without interoperability issues.
The list of dependancies uploaded in the current environment is given in the list below:
pip list
Package                       Version
----------------------------- -------------------
alabaster                     0.7.12
anyio                         3.3.4
argon2-cffi                   21.1.0
async-generator               1.10
attrs                         21.2.0
Babel                         2.9.1
backcall                      0.2.0
backports.functools-lru-cache 1.6.4
beautifulsoup4                4.10.0
bleach                        4.1.0
brotlipy                      0.7.0
certifi                       2021.10.8
cffi                          1.15.0
cftime                        1.5.1.1
chardet                       4.0.0
charset-normalizer            2.0.0
click                         7.1.2
click-completion              0.5.2
click-log                     0.3.2
click-plugins                 1.1.1
cligj                         0.7.1
cloudpickle                   1.6.0
colorama                      0.4.4
cryptography                  35.0.0
cycler                        0.10.0
dataclasses                   0.8
decorator                     5.0.9
defusedxml                    0.7.1
docutils                      0.16
entrypoints                   0.3
Fiona                         1.8.18
future                        0.18.2
GDAL                          3.1.4
geopandas                     0.9.0
gitdb                         4.0.9
GitPython                     3.1.24
greenlet                      1.1.2
idna                          3.1
imagesize                     1.3.0
importlib-metadata            4.8.2
importlib-resources           3.3.1
ipykernel                     5.5.5
ipython                       7.23.1
ipython-genutils              0.2.0
ipywidgets                    7.6.5
jedi                          0.18.0
Jinja2                        3.0.3
jsonschema                    3.2.0
jupyter                       1.0.0
jupyter-book                  0.12.0
jupyter-cache                 0.4.3
jupyter-client                6.1.12
jupyter-console               6.4.0
jupyter-core                  4.7.1
jupyter-server                1.11.2
jupyter-server-mathjax        0.2.3
jupyter-sphinx                0.3.2
jupyterlab-pygments           0.1.2
jupyterlab-widgets            1.0.2
jupytext                      1.11.5
kiwisolver                    1.3.2
latexcodec                    2.0.1
linkify-it-py                 1.0.2
lxml                          4.6.4
markdown-it-py                1.1.0
MarkupSafe                    2.0.1
matplotlib                    3.4.3
matplotlib-inline             0.1.2
mdit-py-plugins               0.2.8
mistune                       0.8.4
munch                         2.5.0
myst-nb                       0.13.1
myst-parser                   0.15.2
nbclient                      0.5.5
nbconvert                     6.2.0
nbdime                        3.1.1
nbformat                      5.1.3
Note: you may need to restart the kernel to use updated packages.
nest-asyncio                  1.5.1
netCDF4                       1.5.7
notebook                      6.4.5
numpy                         1.20.3
obspy                         1.2.2
olefile                       0.46
packaging                     21.2
pandas                        1.2.4
pandocfilters                 1.5.0
parso                         0.8.2
pickleshare                   0.7.5
Pillow                        8.3.1
pip                           21.1.2
prometheus-client             0.12.0
prompt-toolkit                3.0.18
pybtex                        0.24.0
pybtex-docutils               1.0.1
pycparser                     2.21
pydata-sphinx-theme           0.6.3
Pygments                      2.9.0
pyOpenSSL                     21.0.0
pyparsing                     2.4.7
pyproj                        3.1.0
PyQt5                         5.12.3
PyQt5-sip                     4.19.18
PyQtChart                     5.12
PyQtWebEngine                 5.12.1
pyrsistent                    0.18.0
PySocks                       1.7.1
python-dateutil               2.8.1
pytz                          2021.1
pywin32                       300
pywinpty                      1.1.4
PyYAML                        6.0
pyzmq                         22.1.0
qtconsole                     5.1.1
QtPy                          1.11.2
requests                      2.26.0
Rtree                         0.9.7
scipy                         1.6.3
Send2Trash                    1.8.0
setuptools                    49.6.0.post20210108
Shapely                       1.7.1
shellingham                   1.4.0
six                           1.16.0
smmap                         3.0.5
sniffio                       1.2.0
snowballstemmer               2.1.0
soupsieve                     2.3
Sphinx                        4.3.0
sphinx-book-theme             0.1.6
sphinx-comments               0.0.3
sphinx-copybutton             0.4.0
sphinx-external-toc           0.2.3
sphinx-jupyterbook-latex      0.4.5
sphinx-multitoc-numbering     0.1.3
sphinx-panels                 0.6.0
sphinx-thebe                  0.0.10
sphinx-togglebutton           0.2.3
sphinxcontrib-applehelp       1.0.2
sphinxcontrib-bibtex          2.2.1
sphinxcontrib-devhelp         1.0.2
sphinxcontrib-htmlhelp        2.0.0
sphinxcontrib-jsmath          1.0.1
sphinxcontrib-qthelp          1.0.3
sphinxcontrib-serializinghtml 1.1.5
spyder-kernels                1.10.2
SQLAlchemy                    1.4.26
terminado                     0.12.1
testpath                      0.5.0
toml                          0.10.2
tornado                       6.1
traitlets                     5.0.5
typing-extensions             3.10.0.2
uc-micro-py                   1.0.1
urllib3                       1.26.7
wcwidth                       0.2.5
webencodings                  0.5.1
websocket-client              0.57.0
wheel                         0.36.2
widgetsnbextension            3.5.2
win-inet-pton                 1.1.0
wincertstore                  0.2
zipp                          3.6.0
Upload the modules#
geopandas: used to create geodataframe and easily save the result to shapefiles or geopackages.
Other modules: pandas, os, glob, math, shapely, pathlib
import os
import glob
import math
import pandas as pd
import geopandas as gpd
from shapely.geometry import LineString, Point
from pathlib import Path
Initiate the different variables#
aerogeophysics_data = 'D:/BEDMAP/AWI_2015_GEA-DML_AIR_BM3.csv'
ID = aerogeophysics_data.split('/')[-1].strip('.csv')
ID_split = ID.split('_')
print('ID: %s' %ID)
ID: AWI_2015_GEA-DML_AIR_BM3
Open the standardised CSV files#
The code reads the standardised csv files using pandas. A number of columns are droped as they are not useful for the creation of the tracklines such as the line, date, time or trace.
file = pd.read_csv(aerogeophysics_data, skiprows=18)
variables = file.columns.tolist()
line = [variable for variable in file.columns.tolist() if (variable.startswith('trajectory'))][0]
date = [variable for variable in file.columns.tolist() if (variable.startswith('date'))][0]
time  = [variable for variable in file.columns.tolist() if (variable.startswith('time'))][0]
trace = [variable for variable in file.columns.tolist() if (variable.startswith('trace'))][0]
file = file.drop(columns=[line, trace, date, time])
file = file.drop(columns=variables[9:])
The data are saved into a dataframe called “file”. You can see what the dataframe looks like in the table below.
file.head()
| longitude (degree_east) | latitude (degree_north) | surface_altitude (m) | land_ice_thickness (m) | bedrock_altitude (m) | |
|---|---|---|---|---|---|
| 0 | -5.7951 | -71.0262 | -9999 | 463.7 | -9999 |
| 1 | -5.7937 | -71.0264 | -9999 | 463.7 | -9999 |
| 2 | -5.7871 | -71.0275 | -9999 | 456.3 | -9999 |
| 3 | -5.7824 | -71.0282 | -9999 | 452.6 | -9999 |
| 4 | -5.7729 | -71.0296 | -9999 | 445.3 | -9999 |
Saving the data as a geo-dataframe#
The data are then saved into a geodataframe using the geopandas module. This line of code will convert the latitude and longitude value into a specific point geometry.
gdf = gpd.GeoDataFrame(file, geometry=gpd.points_from_xy(file['longitude (degree_east)'], file['latitude (degree_north)']))

gdf.head()
| longitude (degree_east) | latitude (degree_north) | surface_altitude (m) | land_ice_thickness (m) | bedrock_altitude (m) | geometry | |
|---|---|---|---|---|---|---|
| 0 | -5.7951 | -71.0262 | -9999 | 463.7 | -9999 | POINT (-5.79510 -71.02620) |
| 1 | -5.7937 | -71.0264 | -9999 | 463.7 | -9999 | POINT (-5.79370 -71.02640) |
| 2 | -5.7871 | -71.0275 | -9999 | 456.3 | -9999 | POINT (-5.78710 -71.02750) |
| 3 | -5.7824 | -71.0282 | -9999 | 452.6 | -9999 | POINT (-5.78240 -71.02820) |
| 4 | -5.7729 | -71.0296 | -9999 | 445.3 | -9999 | POINT (-5.77290 -71.02960) |
Setting up the coordinate system#
The data are proposed as latitude and longitude from the WGS84 EPSG 4326 geographic system. We thus set the right coordinate system as follows:
gdf = gdf.set_crs("EPSG:4326")
Converting the data to the Antarctic Stereographic geographic system#
To calculate specific parameters, such as the distance between two points, we project the data to the Antarctic Stereographic EPSG 3031 system:
gdf = gdf.to_crs("EPSG:3031")
Calculating the distance between two points#
We then calculate the distance between two points using the geodataframe function called distance. This will add a specific column to our geodataframe:
file['distance'] = gdf.distance(gdf.shift(1))
file.head()
| longitude (degree_east) | latitude (degree_north) | surface_altitude (m) | land_ice_thickness (m) | bedrock_altitude (m) | geometry | distance | |
|---|---|---|---|---|---|---|---|
| 0 | -5.7951 | -71.0262 | -9999 | 463.7 | -9999 | POINT (-5.79510 -71.02620) | NaN |
| 1 | -5.7937 | -71.0264 | -9999 | 463.7 | -9999 | POINT (-5.79370 -71.02640) | 55.502482 |
| 2 | -5.7871 | -71.0275 | -9999 | 456.3 | -9999 | POINT (-5.78710 -71.02750) | 269.174280 |
| 3 | -5.7824 | -71.0282 | -9999 | 452.6 | -9999 | POINT (-5.78240 -71.02820) | 187.620910 |
| 4 | -5.7729 | -71.0296 | -9999 | 445.3 | -9999 | POINT (-5.77290 -71.02960) | 378.527249 |
Converting the points to lines#
Then, we need to convert the points to line. The code will create a line between points whose distance is inferior to 15km. This is to showcase the location where data have not been recorded. We will then use the groupbyfunction from geopandas to group the points together and create a line.
segmentID = 0
segment = []
max_distance = 1000#min([1000, file.distance.mean()*10])
print('Mean distance between points: %s m' %round(file.distance.mean()))
if file.distance.mean() < 15000:
    for index, row in file.iterrows():
        if ID_split[0] == 'STANFORD' and row.distance <= 20000 or row.distance == 'NaN':
            segment.append('%s_segment%s' %(ID, segmentID))
        elif 'Recovery-Glacier' in ID_split[0:3] and row.distance <= 3000 or row.distance == 'NaN':
            segment.append('%s_segment%s' %(ID, segmentID))
        elif 'GEA-IV' in ID_split[0:3] and row.distance <= 3000 or row.distance == 'NaN':
            segment.append('%s_segment%s' %(ID, segmentID))
        elif ID_split[0] != 'STANFORD' and row.distance <= max_distance or row.distance == 'NaN':
            segment.append('%s_segment%s' %(ID, segmentID))
        else:
            segmentID = segmentID +1
            segment.append('%s_segment%s' %(ID, segmentID))
    gdf['segment'] = segment
    gdf = gdf.groupby(['segment'])['geometry'].apply(lambda x: LineString(x.tolist()) if x.size > 1 else x.tolist()[0])
    gdf = gpd.GeoDataFrame(gdf, geometry='geometry')
Mean distance between points: 485 m
Adding parameters and removing points#
    gdf['Provider'] = ID_split[0]
    gdf['Campaign'] = ID_split[2]
    gdf['Year'] = ID_split[1]
    gdf = gdf.set_crs("EPSG:3031")
    gdf = gdf.reset_index()
    for i in range(0,len(gdf)):
        if type(gdf.geometry[i]) ==Point:
            gdf = gdf.drop(index =i)
Results#
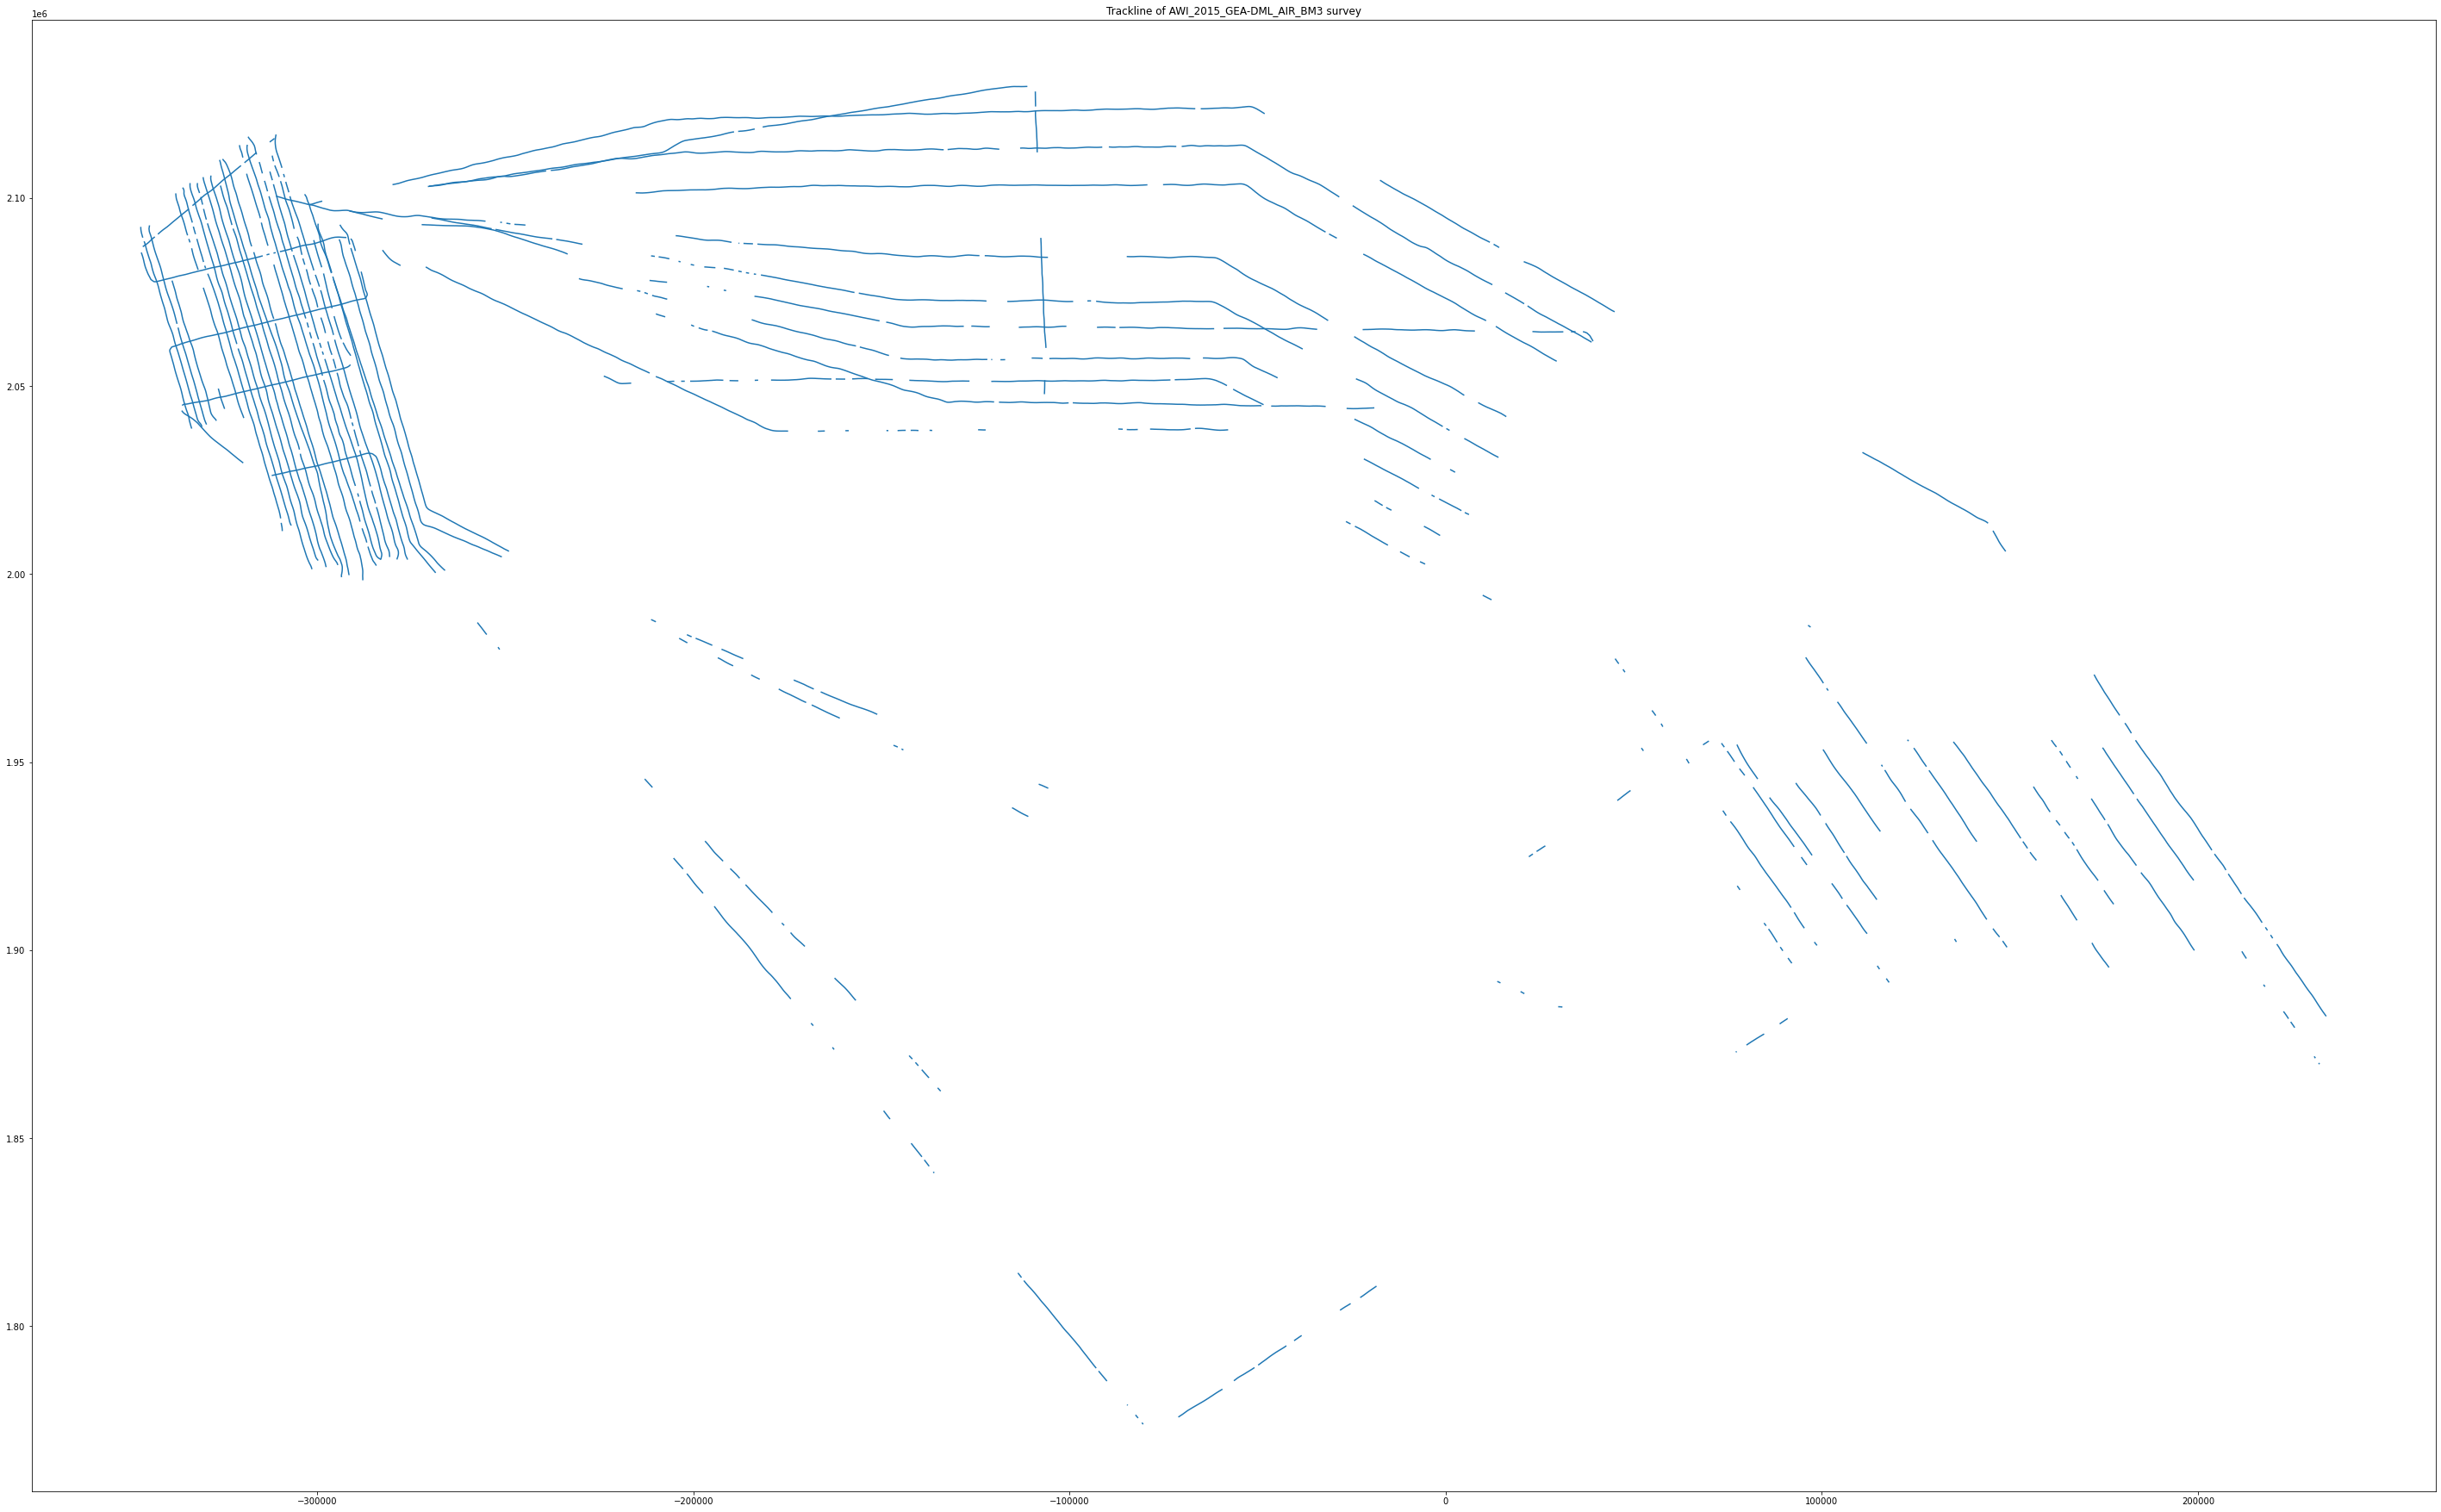
Plotting flight lines#
# This line configures matplotlib to show figures embedded in the notebook,
# instead of opening a new window for each figure. More about that later.
# If you are using an old version of IPython, try using '%pylab inline' instead.
%matplotlib inline
import matplotlib
import matplotlib.pyplot as plt
plt.rcParams['figure.figsize'] = [50,50] # Set the size of the inline plot


fig, ax = plt.subplots(1, 1)
fig=plt.figure(figsize=(20,20), dpi= 300, facecolor='w', edgecolor='k')
gdf.plot(ax=ax)
ax.set_title('Trackline of %s survey' %ID)
Text(0.5, 1.0, 'Trackline of AWI_2015_GEA-DML_AIR_BM3 survey')
<Figure size 6000x6000 with 0 Axes>
Results#
All the BEDMAP lines shapefiles are available online:
BEDMAP2 shapeLines: https://doi.org/10.5285/0f90d926-99ce-43c9-b536-0c7791d1728b
BEDMAP3 shapeLines: https://doi.org/10.5285/a72a50c6-a829-4e12-9f9a-5a683a1acc4a
Please note that the lines are not available for BEDMAP1 as it was difficult to separate each survey into one campaign file.